 VENTURA COUNTY — Good Afternoon, Here is your County of Ventura COVID-19 update.
549 new cases: from reports from Thursday through Sunday. 292 have a lab collection from June 29 or earlier.
12,353 new people tested
76,400 total people tested
3,789 total cases
2,029 recovered cases
88 current hospitalizations
30 current ICU
1,710 active cases under quarantine
50 deaths (ages 29-107; 28 males and 17 females) 3 additional deaths included a 62 year old male, 89 year old female and 93 year old male.
 Face Coverings: Even without symptoms, you can expose others to COVID-19. Please wear a mask to slow the spread.
Ventura County Business Assistance Grant Program Applications are available until July 8, 2020. The program includes grants of $5,000 for small businesses to alleviate impacts from COVID-19. Check out the Frequently Asked Questions at https://rapidresponsevc.org/faqs/. Apply today at https://rapidresponsevc.org/.
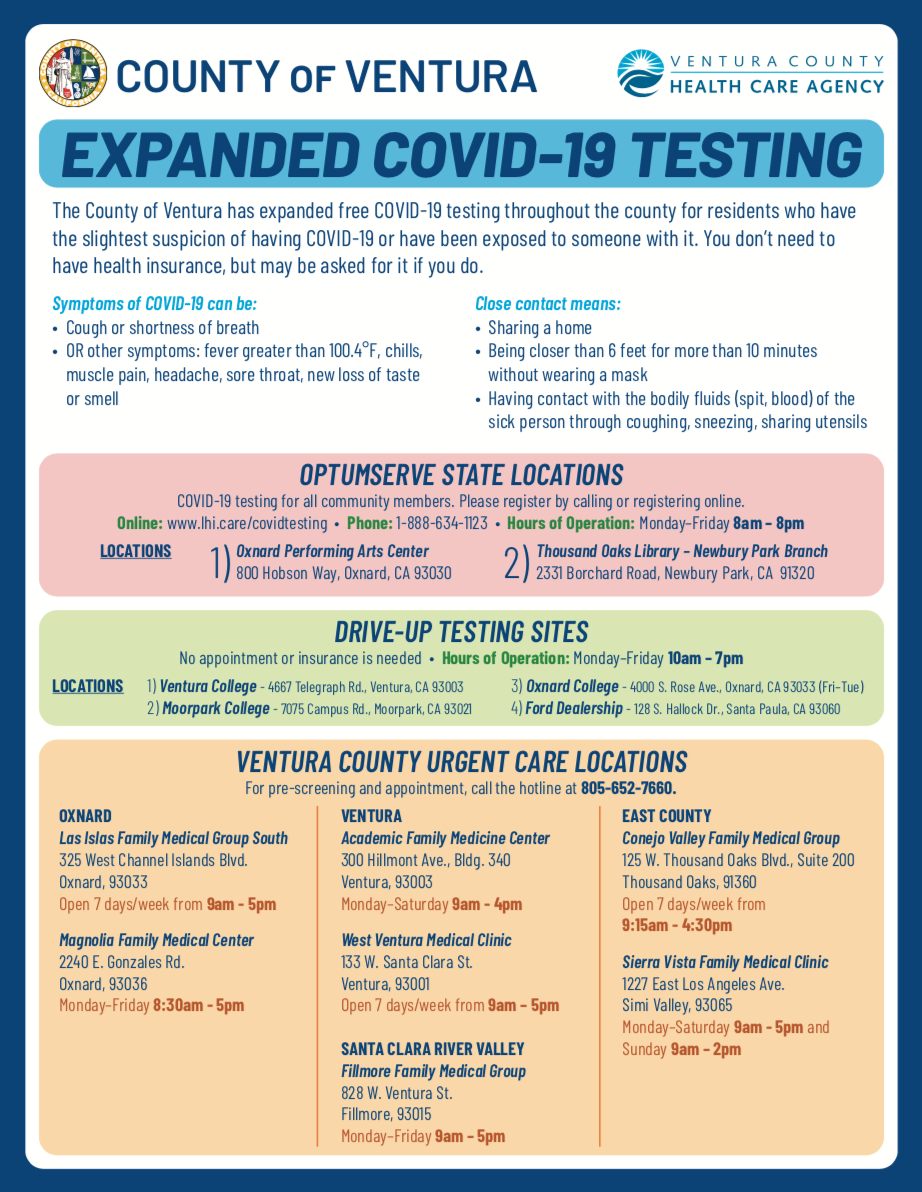
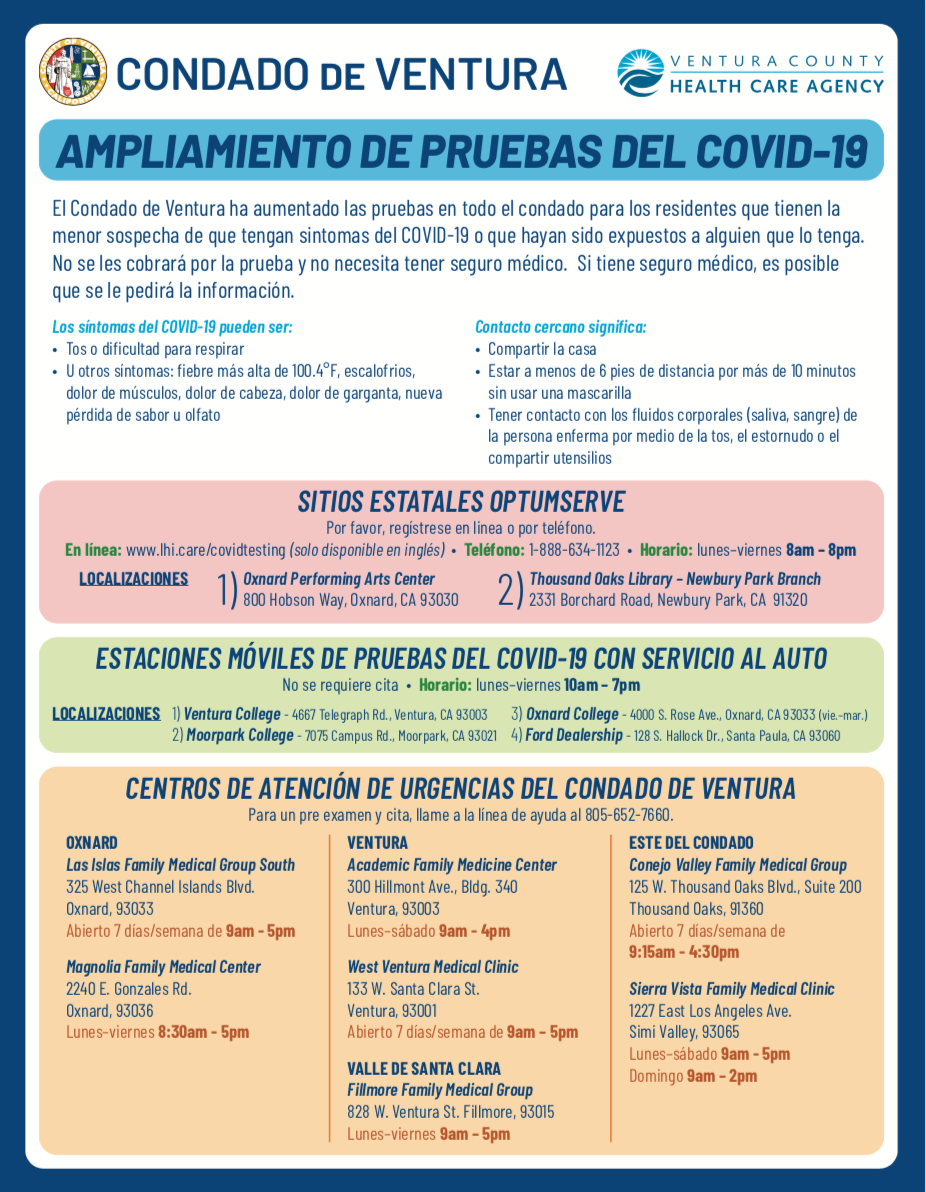
COVID-19 drive through testing sites. No cost. No insurance needed. No appointment needed.
Ford Dealership, 128 S. Hallock Dr., Santa Paula, CA 93060 M-F, 10-7
Moorpark College, 7075 Campus Rd., Moorpark, CA 93021 M-F, 10-7
Oxnard College, 4000 S. Rose Ave., Oxnard, CA 93033 F-T, 10-7
Ventura College, 4667 Telegraph Rd., Ventura CA 93003, M-F, 10-7
Testing also available at all County clinics and state sites. Information in the attached pdf.
Food Share Pop-Up Pantries
7/6 3 pm Ventura County Fairgrounds, 1- W. Harbor Blvd
7/7 5 pm El Rio, Rio Mesa High School, 545 Central Avenue
7/8 3 pm, Oxnard, College Park, 3250 South Rose Avenue
7/9 3 pm, Thousand Oaks, Conejo Creek South, 1300 E. Janss Road
7/10, 3 pm, Santa Paula, Harding Park, 1330 E. Harvard Blvd
7/11, 12:30 pm, Moorpark, Ruben Castro Charities, 5700 Condor Drive
Mental Health and Wellness Resources: https://www.wellnesseveryday.org/
| Summary | # | |||||
| New cases | 549 | |||||
| Total cases (Active, Recovered, and Deaths) | 3,789 | |||||
| Recovered Cases | 2,029 | |||||
| Ever* hospitalizations | 303 | |||||
| Current hospitalizations | 88 | |||||
| Ever ICU* | 100 | |||||
| Current ICU | 30 | |||||
| Active Cases Under Quarantine | 1,710 | |||||
| Deaths | 50 | |||||
| New People Tested | 12,353 | |||||
| Total People Tested | 76,400 | |||||
| *Current hospitalizations does not include those from LTC facilities that no longer require acute care but are being held at the facility to protect others. Current ICU is underreported because we do not get notification when hospitalized patients are transferred to ICU. | ||||||
| Age and Sex of Confirmed Cases: | Female | Male | % | |||
| Age 0-17 | 186 | 180 | 9.7% | |||
| Age 18-24 | 271 | 306 | 15.2% | |||
| Age 25-44 | 634 | 775 | 37.2% | |||
| Age 45-64 | 502 | 540 | 27.5% | |||
| Age 65+ | 185 | 204 | 10.3% | |||
| Unknown | 4 | 2 | 0.2% | |||
| Total | 1,782 | 2,007 | 100.0% | |||
| % by Sex | 47.0% | 53.0% | ||||
| Race/Ethnicity** | % Cases | % Deaths | % of Population | |||
| Latino | 60.1% | 38.0% | 44.5% | |||
| White | 26.1% | 58.0% | 43.2% | |||
| Asian | 2.7% | 2.0% | 7.4% | |||
| African American/Black | 0.8% | 2.0% | 1.7% | |||
| Multiracial | 0.2% | 0.0% | 2.5% | |||
| American Indian or Alaskan Native | 0.3% | 0.0% | 0.3% | |||
| Native Hawaiian or Pacific Islander | 0.4% | 0.0% | 0.2% | |||
| Other | 9.4% | 0.0% | 0.2% | |||
| Total | 100.0% | 100.0% | 100.0% | |||
| **There are 1,022 cases not included in this analysis because of missing race/ethnicity data. | ||||||
| Confirmed Cases: | # | % | ||||
| Travel Related | 18 | 0.5% | ||||
| Person-to-person acquired | 1,222 | 32.3% | ||||
| Community acquired | 803 | 21.2% | ||||
| Under investigation | 1,746 | 46.1% | ||||
| Total | 3,789 | 100.0% | ||||
| City/Zip*** | # | % of Total | Population**** | Rate per 100,000 pop. | ||
| 91320 – Thousand Oaks/Newbury Park | 128 | 3.4% | 46,191 | 277.1 | ||
| 91360 – Thousand Oaks | 131 | 3.5% | 42,104 | 311.1 | ||
| 91361 – Thousand Oaks/Lake Sherwood/Westlake | 43 | 1.1% | 20,487 | 209.9 | ||
| 91362 – Thousand Oaks/Westlake | 82 | 2.2% | 34,056 | 240.8 | ||
| 91377 – Oak Park | 36 | 1.0% | 14,226 | 253.1 | ||
| 93001 – Ventura | 118 | 3.1% | 33,139 | 356.1 | ||
| 93003 – Ventura | 158 | 4.2% | 51,304 | 308.0 | ||
| 93004 – Ventura | 68 | 1.8% | 30,473 | 223.1 | ||
| 93010 – Camarillo | 94 | 2.5% | 44,240 | 212.5 | ||
| 93012 – Camarillo/Santa Rosa Valley | 59 | 1.6% | 37,622 | 156.8 | ||
| 93015 – Fillmore | 236 | 6.2% | 18,832 | 1253.2 | ||
| 93021 – Moorpark | 191 | 5.0% | 38,325 | 498.4 | ||
| 93022 – Oak View | 12 | 0.3% | 5,550 | 216.2 | ||
| 93023 – Ojai | 26 | 0.7% | 20,656 | 125.9 | ||
| 93030 – Oxnard | 501 | 13.2% | 62,016 | 807.9 | ||
| 93033 – Oxnard | 528 | 13.9% | 83,319 | 633.7 | ||
| 93035 – Oxnard | 94 | 2.5% | 28,321 | 331.9 | ||
| 93036 – Oxnard | 189 | 5.0% | 48,022 | 393.6 | ||
| 93040 – Piru | 69 | 1.8% | 1,831 | 3768.4 | ||
| 93041 – Port Hueneme | 77 | 2.0% | 24,129 | 319.1 | ||
| 93060 – Santa Paula | 259 | 6.8% | 34,229 | 756.7 | ||
| 93063 – Simi Valley (Santa Susana) | 264 | 7.0% | 56,563 | 466.7 | ||
| 93065 – Simi Valley | 405 | 10.7% | 74,780 | 541.6 | ||
| 93066 – Somis | 21 | 0.6% | 3,481 | 603.3 | ||
| Total | 3,789 | 100.0% | 853,896 | 443.7 | ||
| ***23 cases provided a PO Box address that has been assigned to another zip code within the city. | ||||||
| ****Population estimates for 2020 from www.healthmattersinvc.org (Demographics Dashboard). | ||||||