|
Volume 21 / Number 77 /February 2026
|
|
Your Livable Communities Newsletter
|
|
| The Ventura County Civic Alliance’s most recent State of the Region Report released in November 2025 omitted our Key Statistics section. The data for that section comes from the U.S. Census website which was unavailable during the government shutdown in October 2025.
Our first article, based on data since collected from the U.S. Census American Community Survey 5 years (Table S0101), will give you our current status and highlights three cities where population growth is bucking the downward county trend.
The last two articles focus on the needs of our population and the nonprofits that serve them.
As always, let us know what you think.
Stacy Roscoe |
|
|
POPULATION TRENDS FOR COUNTY
by David Marron
|
|
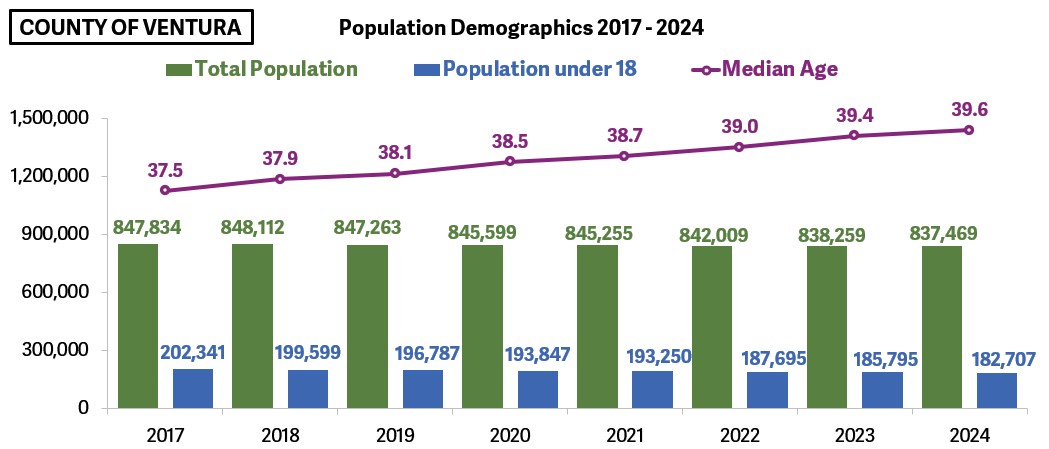
Ventura County – Population declines to 2014 level
Ventura County peaked in 2018 with a population of 848,112 and since then the region’s numbers have declined. The county has also seen a steady increase in the median age as our State of the Region reports have documented for many years. In 2000, the median age in Ventura County was 34.2 and in 2024 it reached 39.6.The median age is the age at the midpoint of the population. Exactly half the population is older and half is younger than median age.
Fewer Ventura County residents in their child-bearing years are having children and most families are having fewer children than previous generations. The 2025 State of the Region report shows the birth rate in Ventura County going back 50 years and the number of births per 1,000 residents has dropped from 19.4 in 1970 to 10.2 in 2023.
While most experts consider Ventura County’s growth earlier this century significantly influenced by migration from Asia, Mexico and other countries, the decline in our county’s population had already begun prior to the current administration’s policies on immigration.
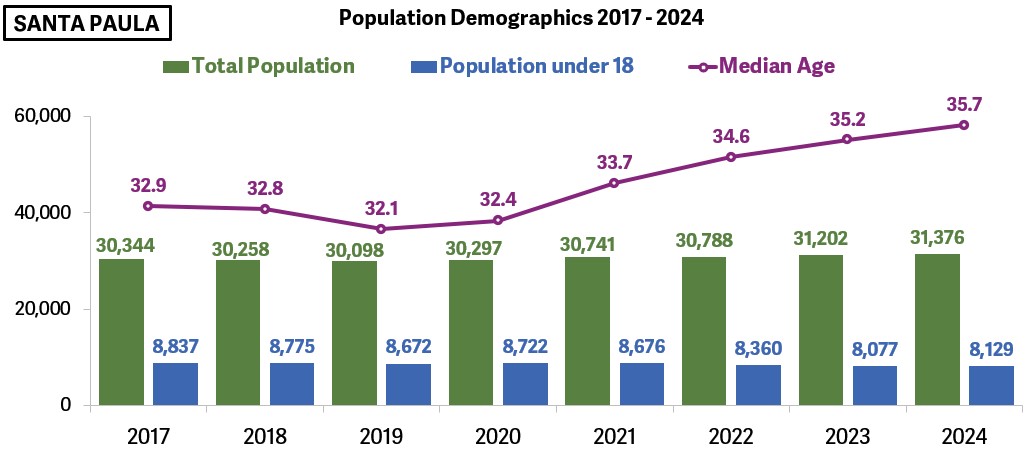
This chart shows Ventura County’s total population has slowly declined since 2017 by about 10,000 residents overall. The blue column is the population under age 18 and the drop there has been far more pronounced – a decline of almost 20,000 children. This plunge results in the rise of the median age.
|
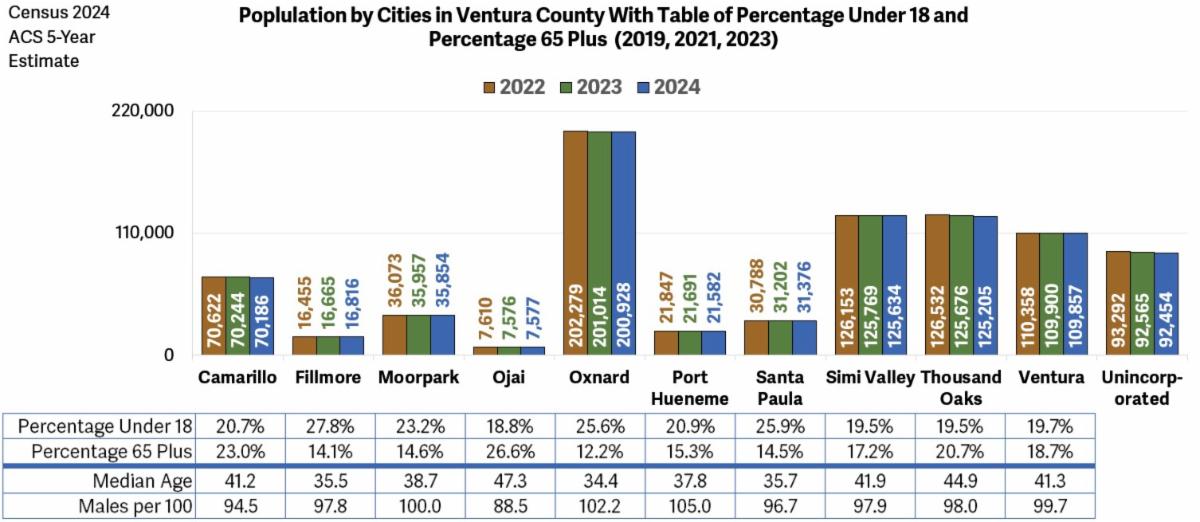
| Population for the ten cities and the unincorporated portion of Ventura County
This chart lists the population for the ten cities in Ventura County for 2022, 2023 and 2024. Below the cities is a table with each city’s percentage of population under 18, over 65, median age and ratio of males per 100 females.
Ojai has the highest percentage of residents 65 and older at 26.6% and Oxnard has the lowest at 12.2%. When it comes to youth, Fillmore and Santa Paula have the most children at 27.8% and 25.9% respectively. |
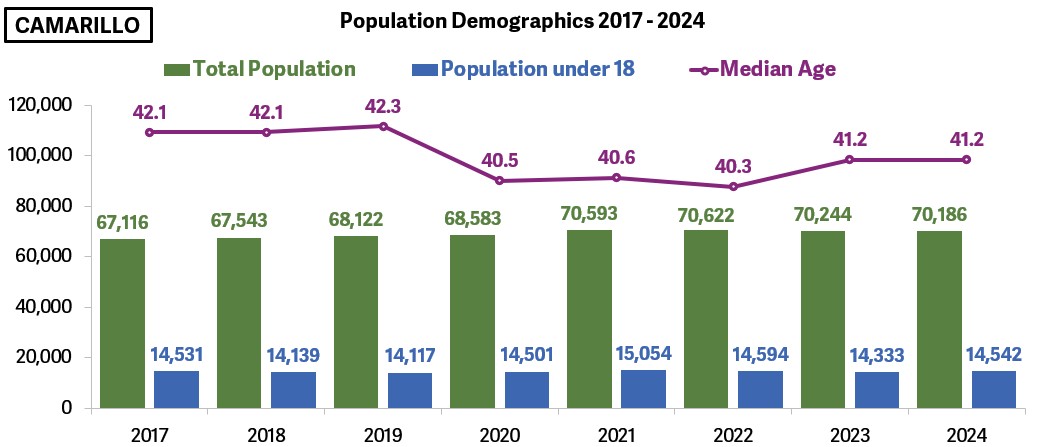
| Since 2017, only three cities gained residents
Over the last seven years, only three cities increased their population. Camarillo grew 4.5%, Fillmore 8.3% and Santa Paula 3.4%. Each city has a different story.
For Camarillo, state estimates show as many as 1,500 housing units were added in various developments which attracted new residents to the city. While the growth in population is good news, the lack of growth in the younger population is troubling. The number of children is virtually identical in 2024 to the 2017 count. The purple line in the chart initially shows a welcome decline in the median age which then starts to increase again in 2023 and 2024. |
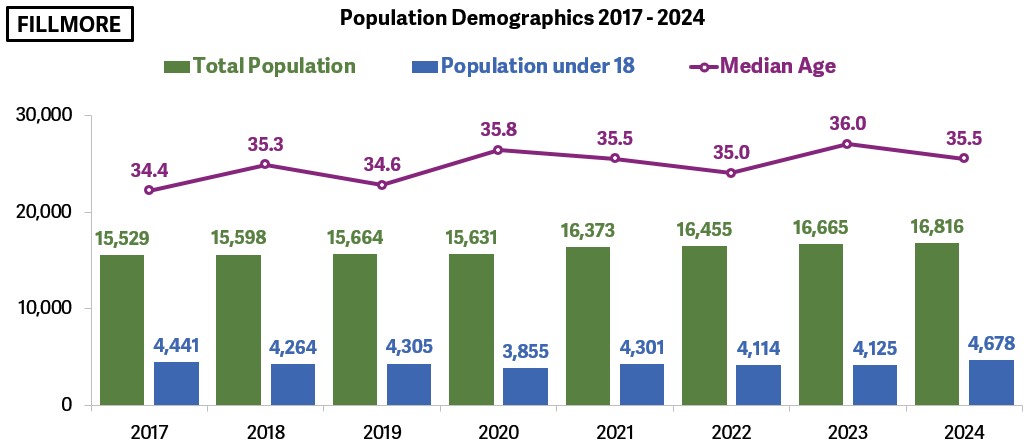
| Fillmore is one of the more affordable cities in Ventura County and has been steadily growing. The fastest growing city since 2017, Fillmore is also attractive to people working in the Santa Clarita area due to the lower cost of housing compared to western Los Angeles County. Fillmore also boasts the only growth in population under 18 since 2017, a 5.3% increase. As the chart shows, their median age is among the lowest in the county. |
| Santa Paula’s 3.4% growth may be a combination of factors. Like Fillmore, housing is more affordable than most parts of Ventura County and similar to Camarillo, significant housing stock became available as the “Harvest at Limoneira” housing development opened and attracted new residents. Unfortunately, Santa Paula’s population under age 18 shrunk over 8% during this same period.
|
| *The source for these charts is the U.S. Census American Community Survey Five Year Estimates (Table S0101). |
|
|
How Strong is Our Safety Net?
How well does Ventura County support its most vulnerable?
|
|
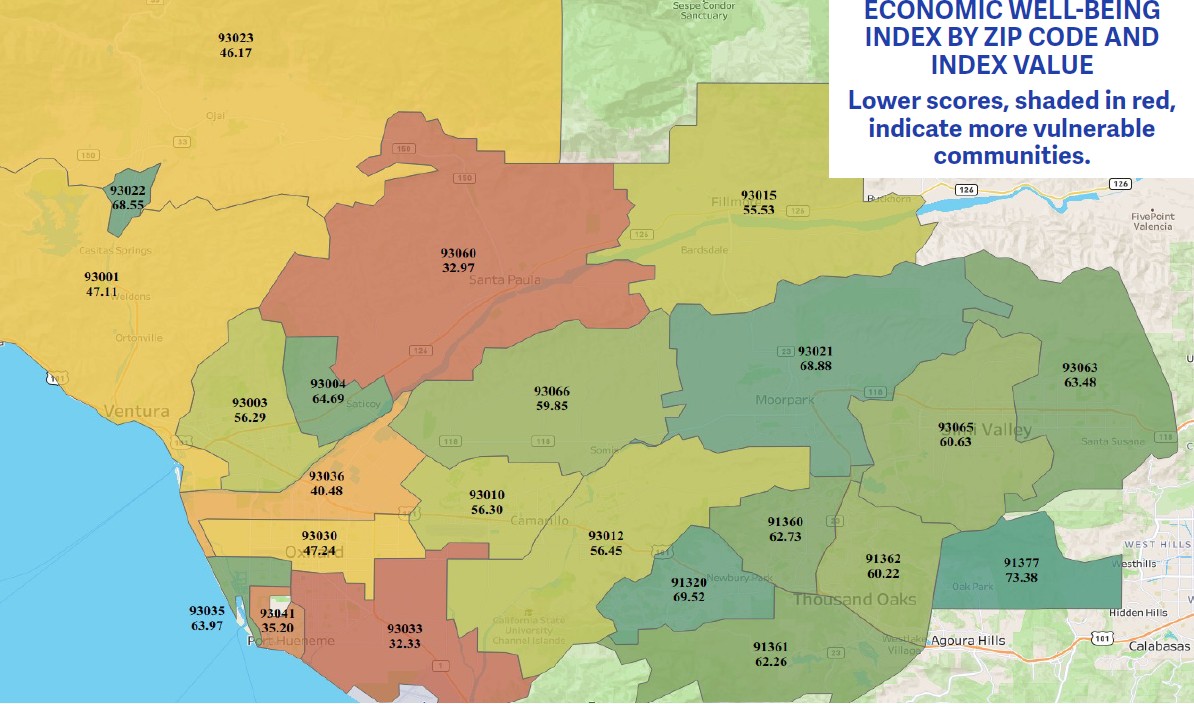
| Where are the vulnerable?
Knowing which areas pose the greatest socio-economic challenges helps public and private social services better target their efforts. The Economic Wellness Index below is arranged by zip code. Based on five-year averages, it is an index of 13 socio-economic indicators that was developed by Dr. Jamshid Damooei, a professor of economics at California Lutheran University. |
|
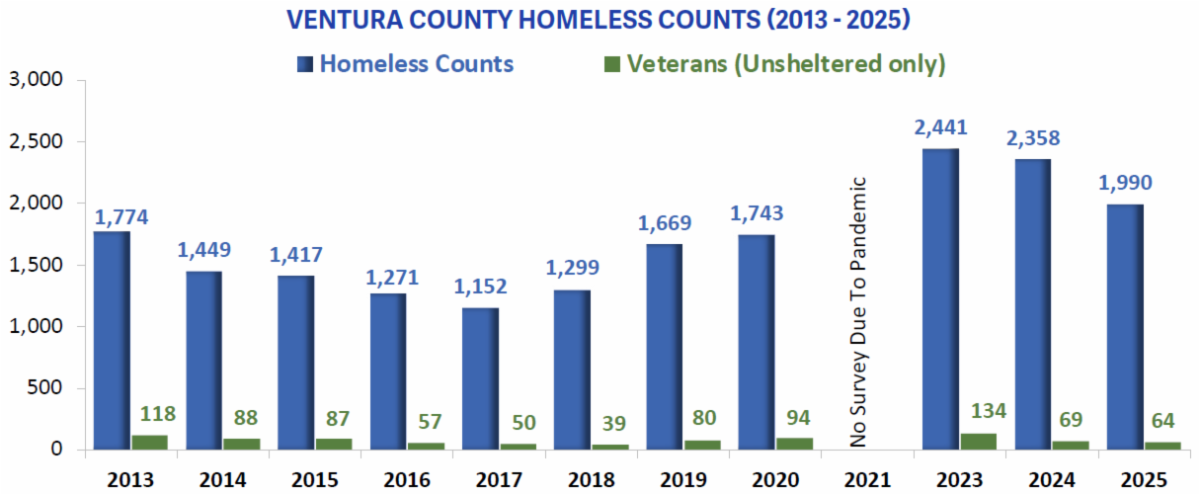
| While the number of homeless people in Ventura County in 2025 reached its lowest point since 2020 and despite major investments in recent years to combat the problem, the number of homeless people in the 2025 count exceeded any year between 2010 and 2020. Homelessness among veterans in the county, however, has dropped by more than half from 2023 to 2025. |
|
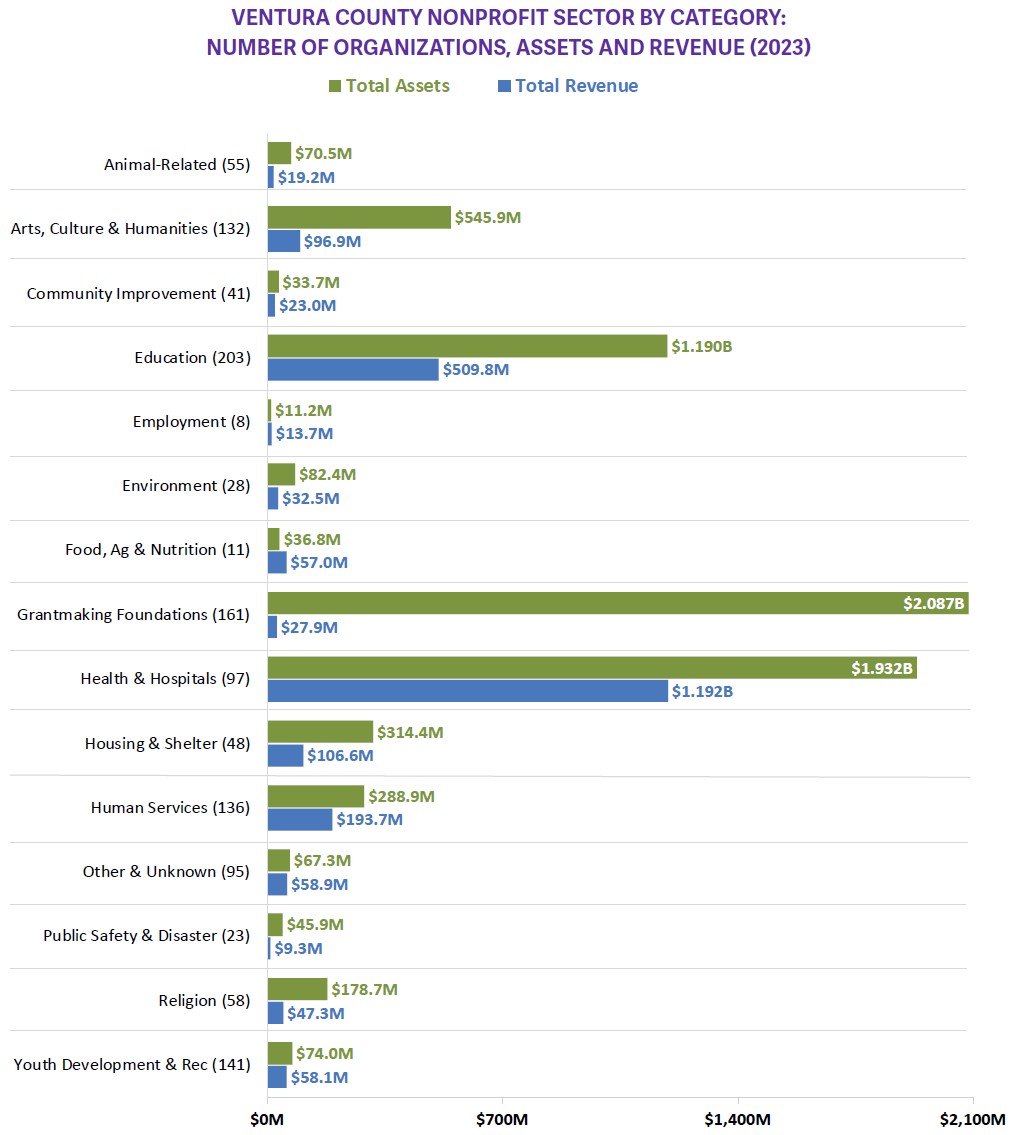
| How do we service those needs?
The number of organizations serving those needs is considerable and they cover a broad range of sectors. |
|
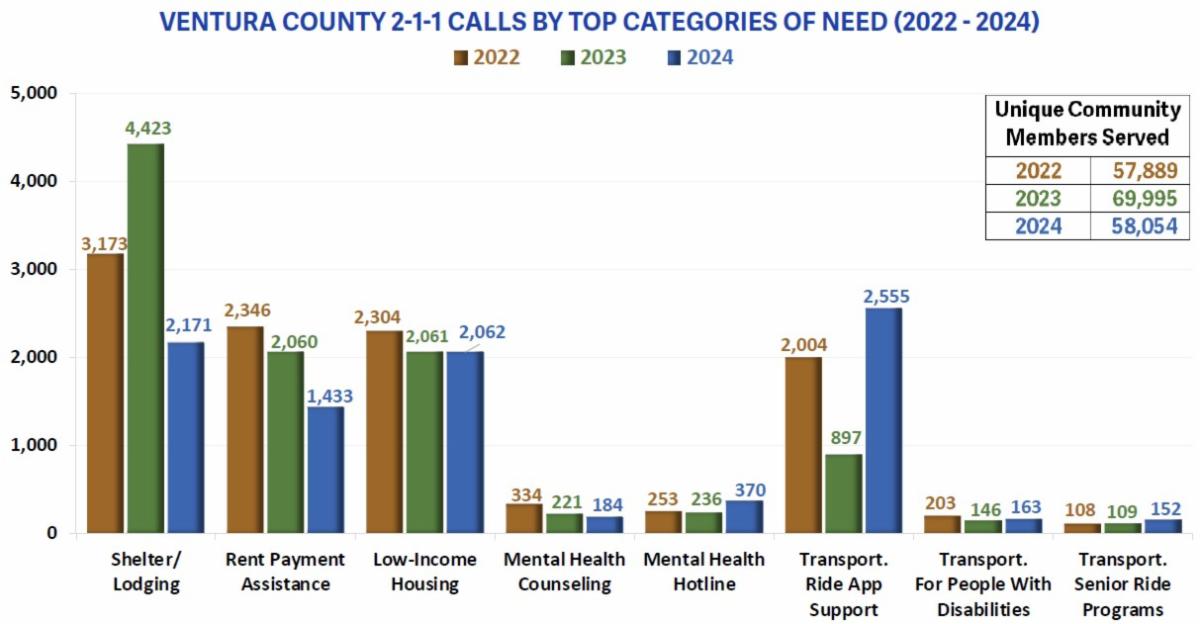
| How do those in need connect with available services?
The 211 hotline service provided by Interface Children & Family Services is a major resource in identifying community needs and connecting callers to government and non-profit agencies who provide food and rent assistance, substance abuse treatment, domestic violence____, and more.
The vast majority of calls concern needs in the area of housing and shelter, but transportation need rose significantly in 2024. |
|
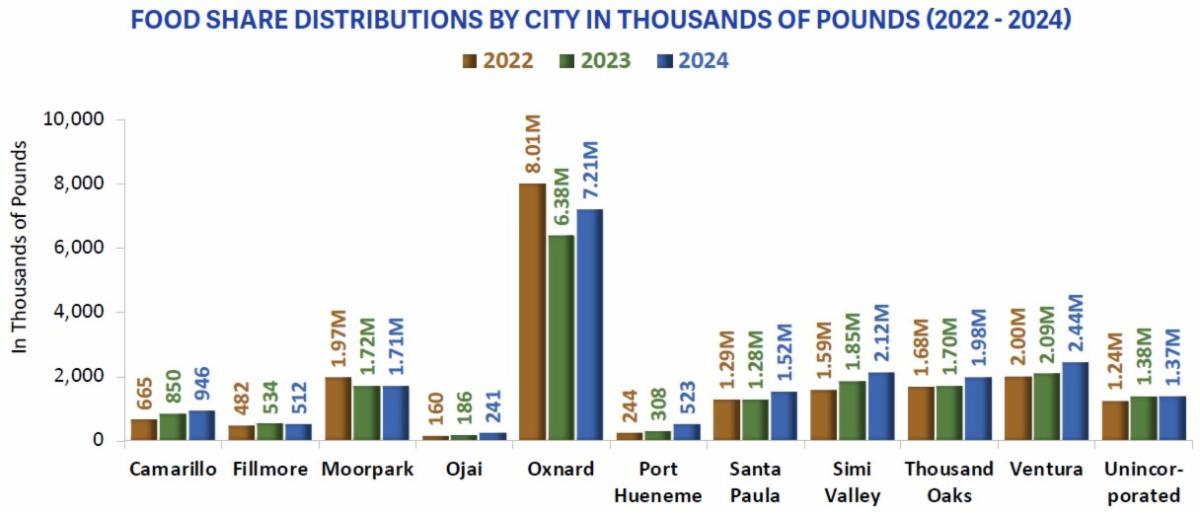
| Food insecurity is another big concern in the county. Food Share, a private food bank and Ventura County’s largest food bank, distributed 20.6 million pounds of food in 2024. This was a 12.7% increase over 2023, and greater than in any single year in Food Share’s more than 40-year history other than 2020 during the pandemic. |
|
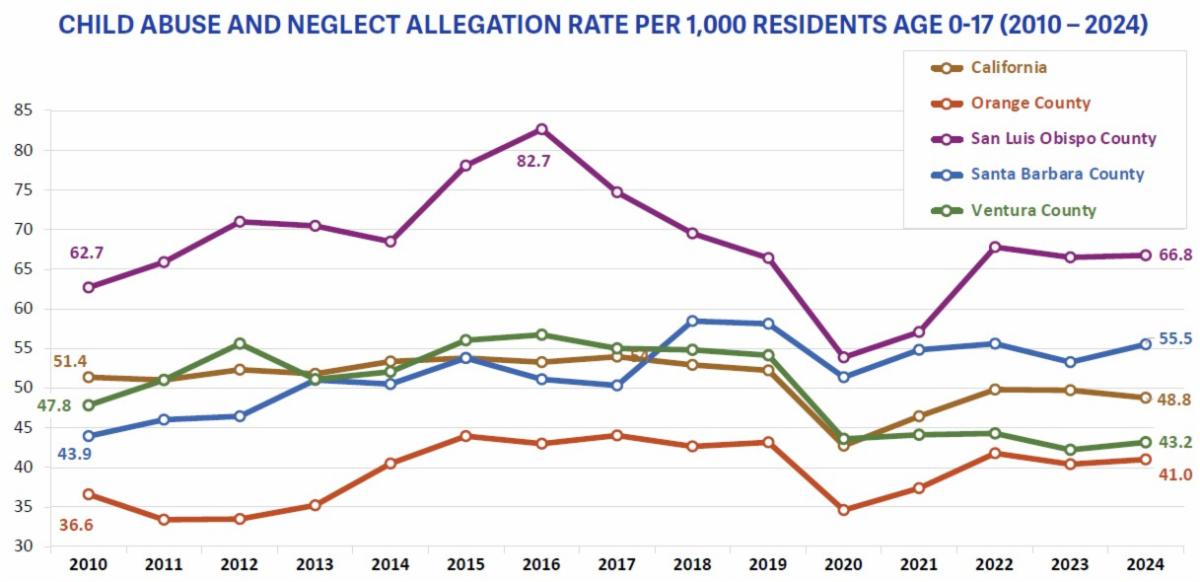
| While the rate of reported child abuse in Ventura County is relatively low compared to the rest of California, that still equated to almost 7,500 children victimized in 2024. The drop in reports in 2020 was most likely due to the more limited contact children had during the pandemic with adults who might notice and report. |
|
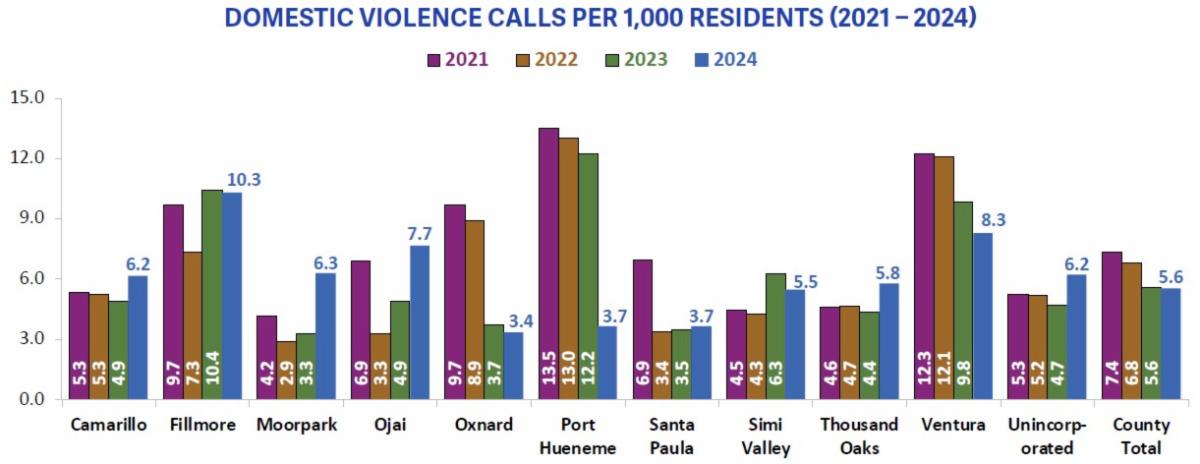
| The number of calls to 911 reporting domestic violence have become much less common in the county, declining 41% from 2015 to 2024. The rate dropped every year from 2015 to 2018, then increased from 2019 to 2021 before declining again. |
|
|
THE SAFETY NET: Non-profits are a key part of supporting the safety net for our most vulnerable.
|
|
|
Crucial to our economic, civic and cultural lives, as well as our physical well-being, non-profits tackle serious social problems, provide support for education and the arts, and some deliver public services through contracts with government agencies.
Who are they?
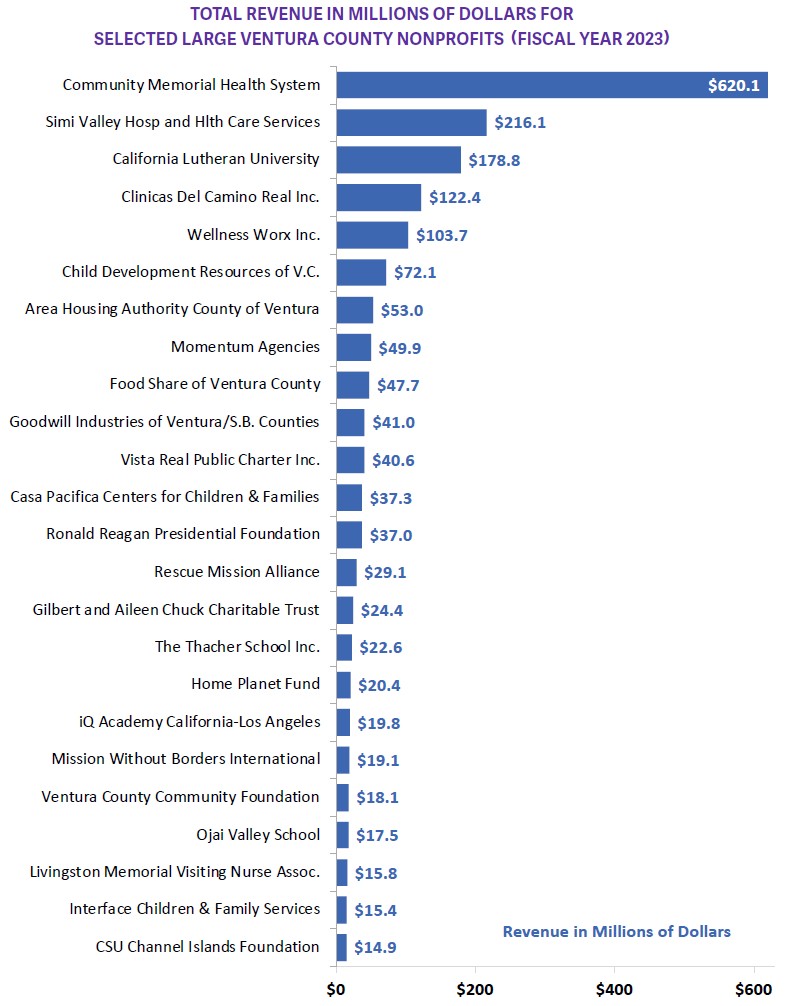
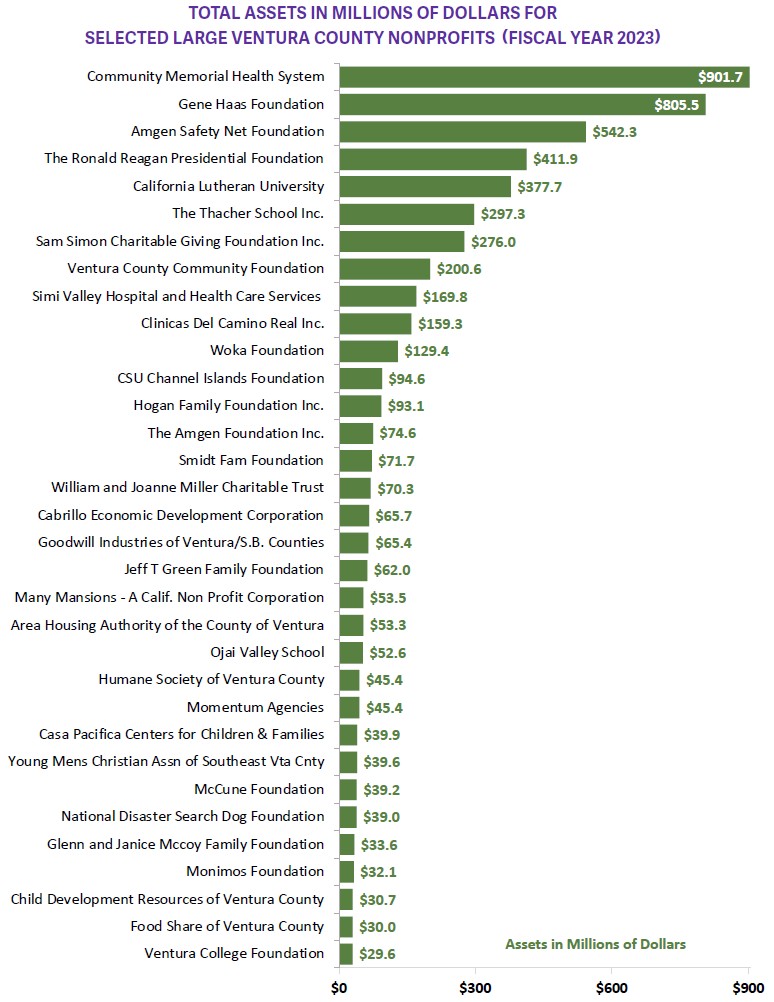
Most of Ventura County’s largest non-profits are healthcare or educational organizations, or organizations that exist to distribute grants to other organizations. |
|
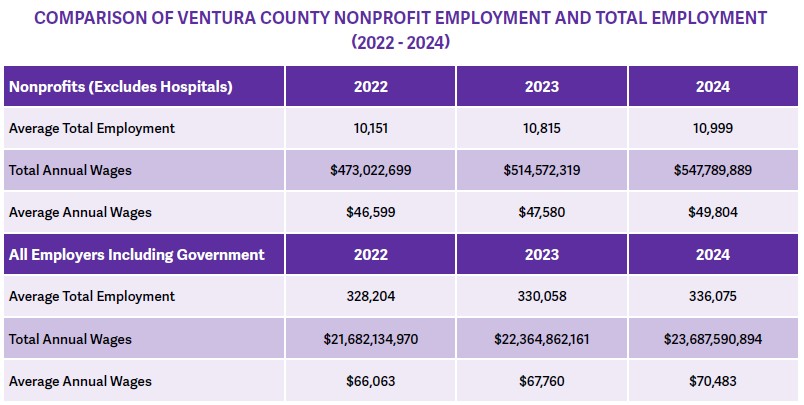
| The non-profits in the county, not counting hospitals, employed about 11,000 people in 2024, which makes up 3.3% of the county’s total workforce.
In general, nonprofits generally pay lower wages than the jobs in the public and private sectors, with average wages in 2024 at just under $50,000 compared to about $70,000 for private businesses and government agencies.
|
|
| In Ventura County the non-profit sector is growing to meet the increasing need. Growing a bit faster than the overall economy, the number of jobs in the sector grew by 8.4% over two years compared to 2.4% growth for all jobs.
How well do we support our Ventura County non-profits?
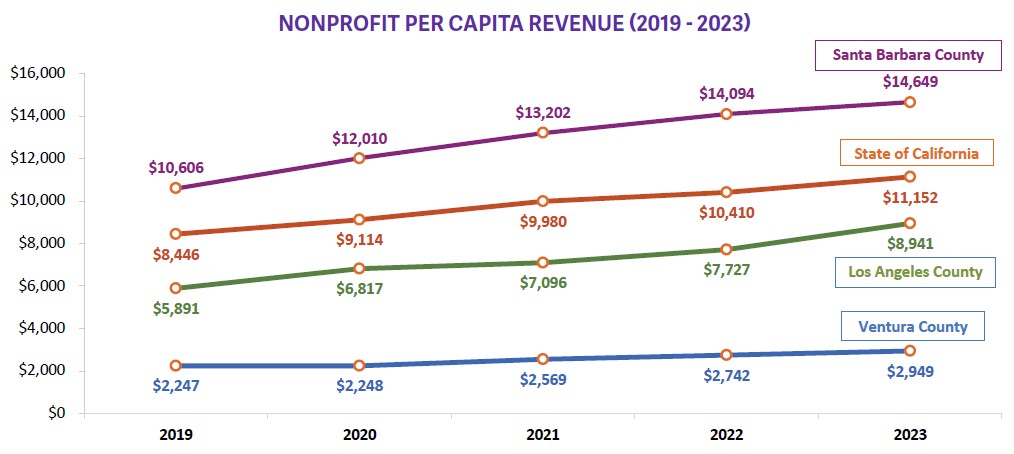
Ventura County’s nonprofits serve the community with significantly less money than the funds available to nonprofits in the state as a whole. In 2023 Ventura County was home to 1,237 nonprofits with at least $50,000 in revenues, which works out to $2,949 per county resident. On a per capita basis, that is 1/3 of the revenue of LA County’s and ¼ of statewide organizations. While there are many complex reasons for that disparity (see details in the 2025 State of the Region Report, p. 26), Ventura County’s growth of revenue has been slower than that the rest of the state and surrounding counties. From 2019 to 2023, our per-capita revenue increased only 31% compared to 32% for the state, 38% for Santa Barbara County and 52% for Los Angeles County. |
|
|
Thank you to our
State of the Region sponsors:
RESEARCH SPONSOR
|
|
|
Montecito Bank
Prospera Succession Partners
The Colleges of Law
Bill & Elise Kearney
|
|
|
Dyer Sheehan Group, Inc.
Maron Software
United Way
Kate McLean and Hon. Steve Stone
Stacy and Kerry Roscoe
|
|
|
|
|