 VENTURA COUNTY — Good Afternoon, Here’s your daily update from the County of Ventura.
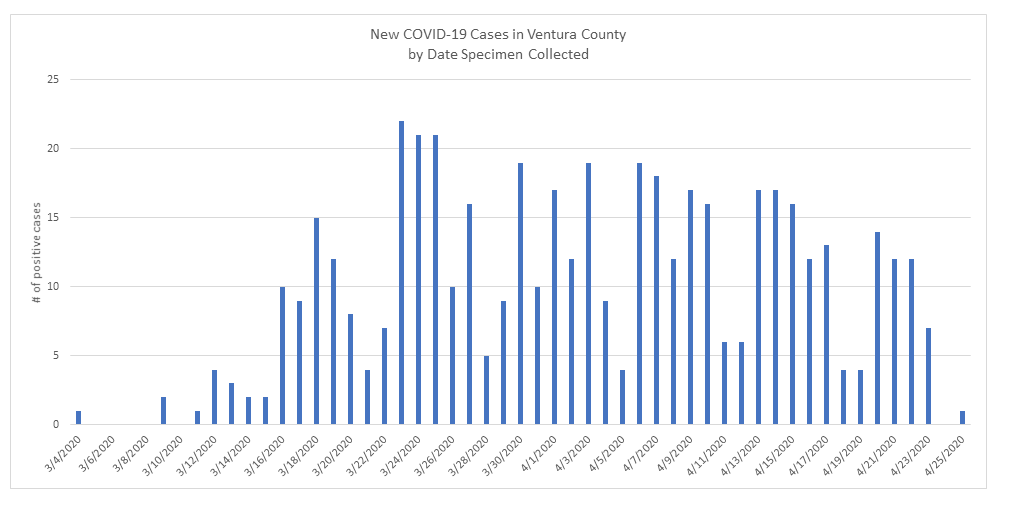
1 new case
209 current cases
497 total cases
271 recovered cases
29 currently at the hospital (7 are long term care facility patients that are not acute for hospital care but staying at the hospitals throughout the county to protect others)
7 ICU patients
17 deaths (9 males and 8 females ages 37-99, 11 passed in the hospital and 6 at home, all had comorbidities)
9,161 tested
Special thanks to our community members for following the soft closure guidelines at local beaches. Coastal law enforcement reported that beach visitors followed the rules and kept moving.
Stay informed at www.vcemergency.com.
| Summary | # | |||
| New cases | 1 | |||
| Total cases | 497 | |||
| Recovered Cases | 271 | |||
| Ever hospitalizations | 96 | |||
| Current hospitalization | 29 | |||
| Ever ICU* | 28 | |||
| Current ICU as of 4/26 | 7 | |||
| Active Cases Under Quarantine | 209 | |||
| Deaths | 17 | |||
| People Tested | 9,161 | |||
| *7 hospital patients are from long term care facilities that are being cared for at hospitals throughout the county to protect other patients at the facilities. They are not acute needing hospital care but staying at the hospital to protect others. | ||||
| Age and Sex of Confirmed Cases: | Female | Male | % | |
| Age 0-17 | 7 | 5 | 2.4% | |
| Age 18-24 | 28 | 13 | 8.2% | |
| Age 25-44 | 76 | 58 | 27.0% | |
| Age 45-64 | 93 | 104 | 39.6% | |
| Age 65+ | 51 | 62 | 22.7% | |
| Unknown | 0 | 0 | 0.0% | |
| Total | 255 | 242 | 100.0% | |
| % by Sex | 51.3% | 48.7% | ||
| Race/Ethnicity** | % Cases | % Deaths | % of Population | |
| Latino | 41.6% | 17.6% | 44.5% | |
| White | 43.1% | 70.6% | 43.2% | |
| Asian | 6.9% | 5.9% | 7.4% | |
| African American/Black | 1.3% | 5.9% | 1.7% | |
| Multiracial | 0.6% | 0.0% | 2.5% | |
| American Indian or Alaskan Native | 0.3% | 0.0% | 0.3% | |
| Native Hawaiian or Pacific Islander | 1.3% | 0.0% | 0.2% | |
| Other | 5.0% | 0.0% | 0.2% | |
| Total | 100.0% | 100.0% | 100.0% | |
| **There are 177 cases not included in this analysis because of missing race/ethnicity data. | ||||
| Confirmed Cases: | # | % | ||
| Travel Related | 19 | 3.8% | ||
| Person-to-person acquired | 144 | 29.0% | ||
| Community acquired | 255 | 51.3% | ||
| Under investigation | 79 | 15.9% | ||
| Total | 497 | 100.0% | ||
| City/Zip*** | # | % of Total | ||
| 91320 – Thousand Oaks/Newbury Park | 13 | 2.6% | ||
| 91360 – Thousand Oaks | 35 | 7.0% | ||
| 91361 – Thousand Oaks/Lake Sherwood/Westlake | 15 | 3.0% | ||
| 91362 – Thousand Oaks/Westlake | 26 | 5.2% | ||
| 91377 – Oak Park | 12 | 2.4% | ||
| 93001 – Ventura | 13 | 2.6% | ||
| 93003 – Ventura | 13 | 2.6% | ||
| 93004 – Ventura | 9 | 1.8% | ||
| 93010 – Camarillo | 29 | 5.8% | ||
| 93012 – Camarillo/Santa Rosa Valley | 15 | 3.0% | ||
| 93015 – Fillmore | 11 | 2.2% | ||
| 93021 – Moorpark | 27 | 5.4% | ||
| 93022 – Oak View | 2 | 0.4% | ||
| 93023 – Ojai | 5 | 1.0% | ||
| 93030 – Oxnard | 24 | 4.8% | ||
| 93033 – Oxnard | 41 | 8.2% | ||
| 93035 – Oxnard | 23 | 4.6% | ||
| 93036 – Oxnard | 26 | 5.2% | ||
| 93040 – Piru | 3 | 0.6% | ||
| 93041 – Port Hueneme | 11 | 2.2% | ||
| 93060 – Santa Paula | 12 | 2.4% | ||
| 93063 – Simi Valley (Santa Susana) | 37 | 7.4% | ||
| 93065 – Simi Valley | 93 | 18.7% | ||
| 93066 – Somis | 2 | 0.4% | ||
| Total | 497 | 100.0% | ||


