 VENTURA COUNTY — Good Evening, Here’s your daily update of regarding COVID-19 in the County of Ventura:
- 15 cases
- 443 total cases
- 230 recovered cases
- 28 hospitalized
- 11 in the ICU
- 200 active cases under quarantine
- 7,881 tested
- Zip codes are now included in the data.
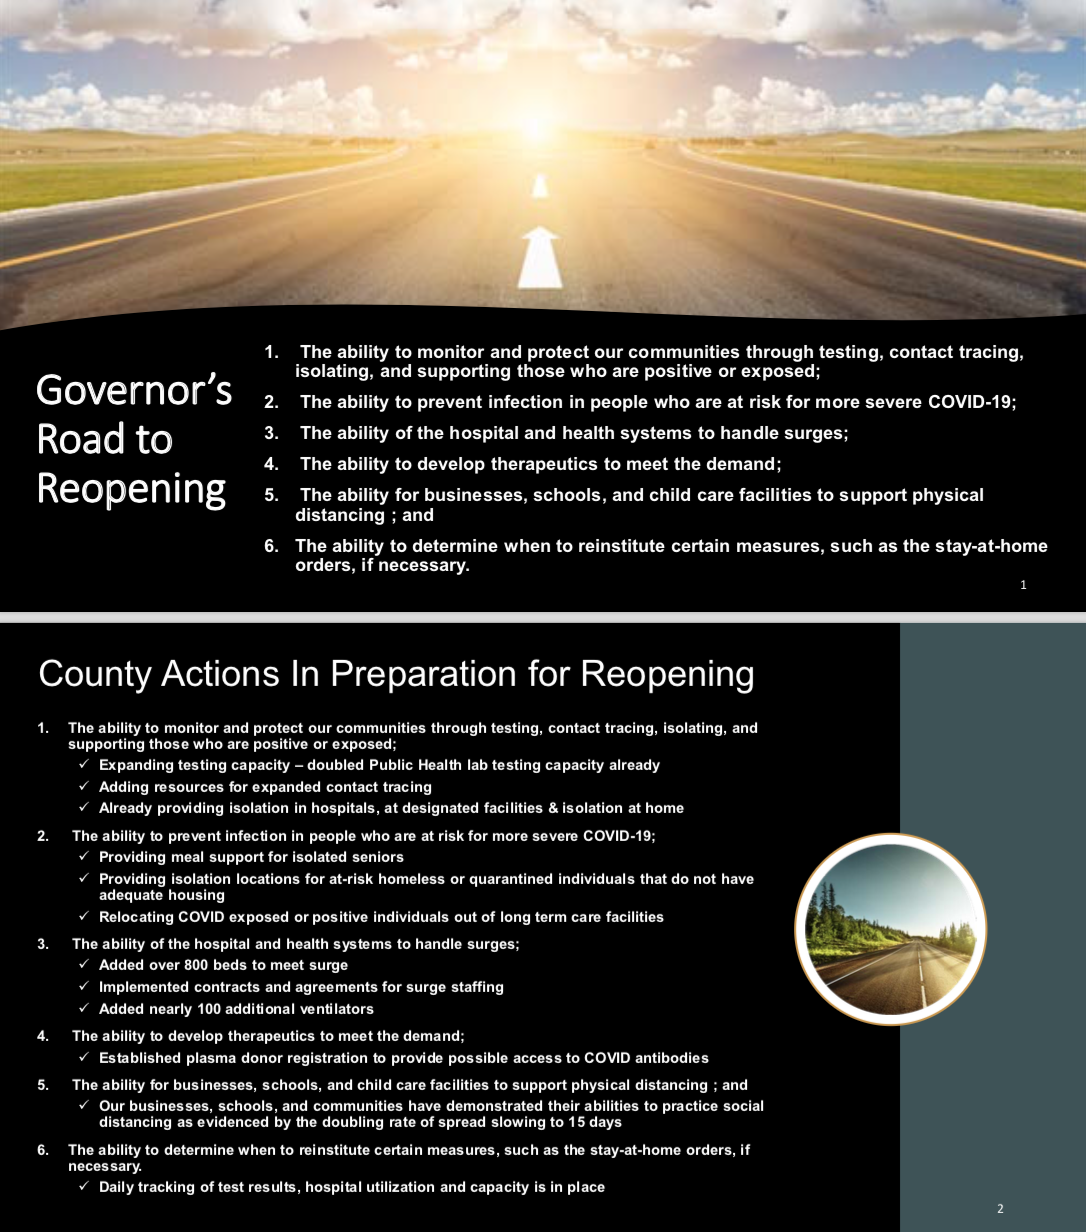
View an update on the Road to Reopening at: https://vimeo.com/410433636.
The Stay Well At Home Order has been modified.
Please view the updated order at https://vcportal.ventura.org/CEO/VCNC/2020-04-18_Signed_15V8544-Final-Final_Master_Ord.pdf.
View the list of essential businesses that are permitted to operate at https://covid19.ca.gov/img/EssentialCriticalInfrastructureWorkers.pdf.
Page 4 item 2 of the Stay Well At Home order describes which businesses can now operate with no more than ten employees.
View today’s full presentation on COVID-19 Response at: https://ventura.granicus.com/player/clip/5413?view_id=67
| Summary | # | |||||||
| New cases | 15 | |||||||
| Total cases | 443 | |||||||
| Recovered Cases | 230 | |||||||
| Current hospitalizations | 28 | |||||||
| Current ICU | 11 | |||||||
| Active Cases Under Quarantine | 200 | |||||||
| Deaths | 13 | |||||||
| People Tested | 7,881 | |||||||
| Age and Sex of Confirmed Cases: | Female | Male | % | Race/Ethnicity** | % Cases | % Deaths | % of Population | |
| Age 0-17 | 6 | 5 | 2.5% | Latino | 37.5% | 8.3% | 44.5% | |
| Age 18-24 | 24 | 12 | 8.1% | White | 47.2% | 91.7% | 43.2% | |
| Age 25-44 | 66 | 52 | 26.6% | Asian | 6.9% | 0.0% | 7.4% | |
| Age 45-64 | 79 | 98 | 40.0% | African American/Black | 1.0% | 0.0% | 1.7% | |
| Age 65+ | 45 | 56 | 22.8% | Multiracial | 0.7% | 0.0% | 2.5% | |
| Unknown | 0 | 0 | 0.0% | American Indian or Alaskan Native | 0.3% | 0.0% | 0.3% | |
| Total | 220 | 223 | 100.0% | Native Hawaiian or Pacific Islander | 1.4% | 0.0% | 0.2% | |
| % by Sex | 49.7% | 50.3% | Other | 4.9% | 0.0% | 0.2% | ||
| Total | 100.0% | 100.0% | 100.0% | |||||
| Confirmed Cases: | # | % | **There are 155 cases not included in this analysis because of missing race/ethnicity data. | |||||
| Travel Related | 19 | 4.3% | ||||||
| Person-to-person acquired | 126 | 28.4% | ||||||
| Community acquired | 228 | 51.5% | ||||||
| Under investigation | 70 | 15.8% | ||||||
| Total | 443 | 100.0% | ||||||
| City/Zip | # | % | ||||||
| 91320 – Thousand Oaks/Newbury Park | 13 | 2.9% | ||||||
| 91360 – Thousand Oaks | 30 | 6.8% | ||||||
| 91361 – Thousand Oaks/Lake Sherwood/Westlake | 15 | 3.4% | ||||||
| 91362 – Thousand Oaks/Westlake | 25 | 5.6% | ||||||
| 91377 – Oak Park | 12 | 2.7% | ||||||
| 93001 – Ventura | 10 | 2.3% | ||||||
| 93003 – Ventura | 13 | 2.9% | ||||||
| 93004 – Ventura | 8 | 1.8% | ||||||
| 93010 – Camarillo | 29 | 6.5% | ||||||
| 93012 – Camarillo/Santa Rosa Valley | 15 | 3.4% | ||||||
| 93015 – Fillmore | 9 | 2.0% | ||||||
| 93021 – Moorpark | 25 | 5.6% | ||||||
| 93022 – Oak View | 2 | 0.5% | ||||||
| 93023 – Ojai | 5 | 1.1% | ||||||
| 93030 – Oxnard | 23 | 5.2% | ||||||
| 93033 – Oxnard | 34 | 7.7% | ||||||
| 93035 – Oxnard | 16 | 3.6% | ||||||
| 93036 – Oxnard | 25 | 5.6% | ||||||
| 93040 – Piru | 3 | 0.7% | ||||||
| 93041 – Port Hueneme | 7 | 1.6% | ||||||
| 93060 – Santa Paula | 7 | 1.6% | ||||||
| 93063 – Simi Valley (Santa Susana) | 33 | 7.4% | ||||||
| 93065 – Simi Valley | 83 | 18.7% | ||||||
| 93066 – Somis | 1 | 0.2% | ||||||
| Total | 443 | 100.0% | ||||||
” src=”blob:http://amigos805.com/6c7acf15-ee1d-486f-a7f0-624424e36452″ alt=”image002.png” border=”0″ class=”Apple-web-attachment Singleton” style=”width: 9.7187in; height: 4.9062in;”>
